Custom Dashboard
Purpose
Create and maintain dashboards that match your role (operator, supervisor, maintenance) and your daily routines.
If custom dashboards are enabled in your deployment, you can add widgets, resize and move them, and lock widgets to a specific machine or time range.
Steps (create a new dashboard)
- Open App > Dashboard.
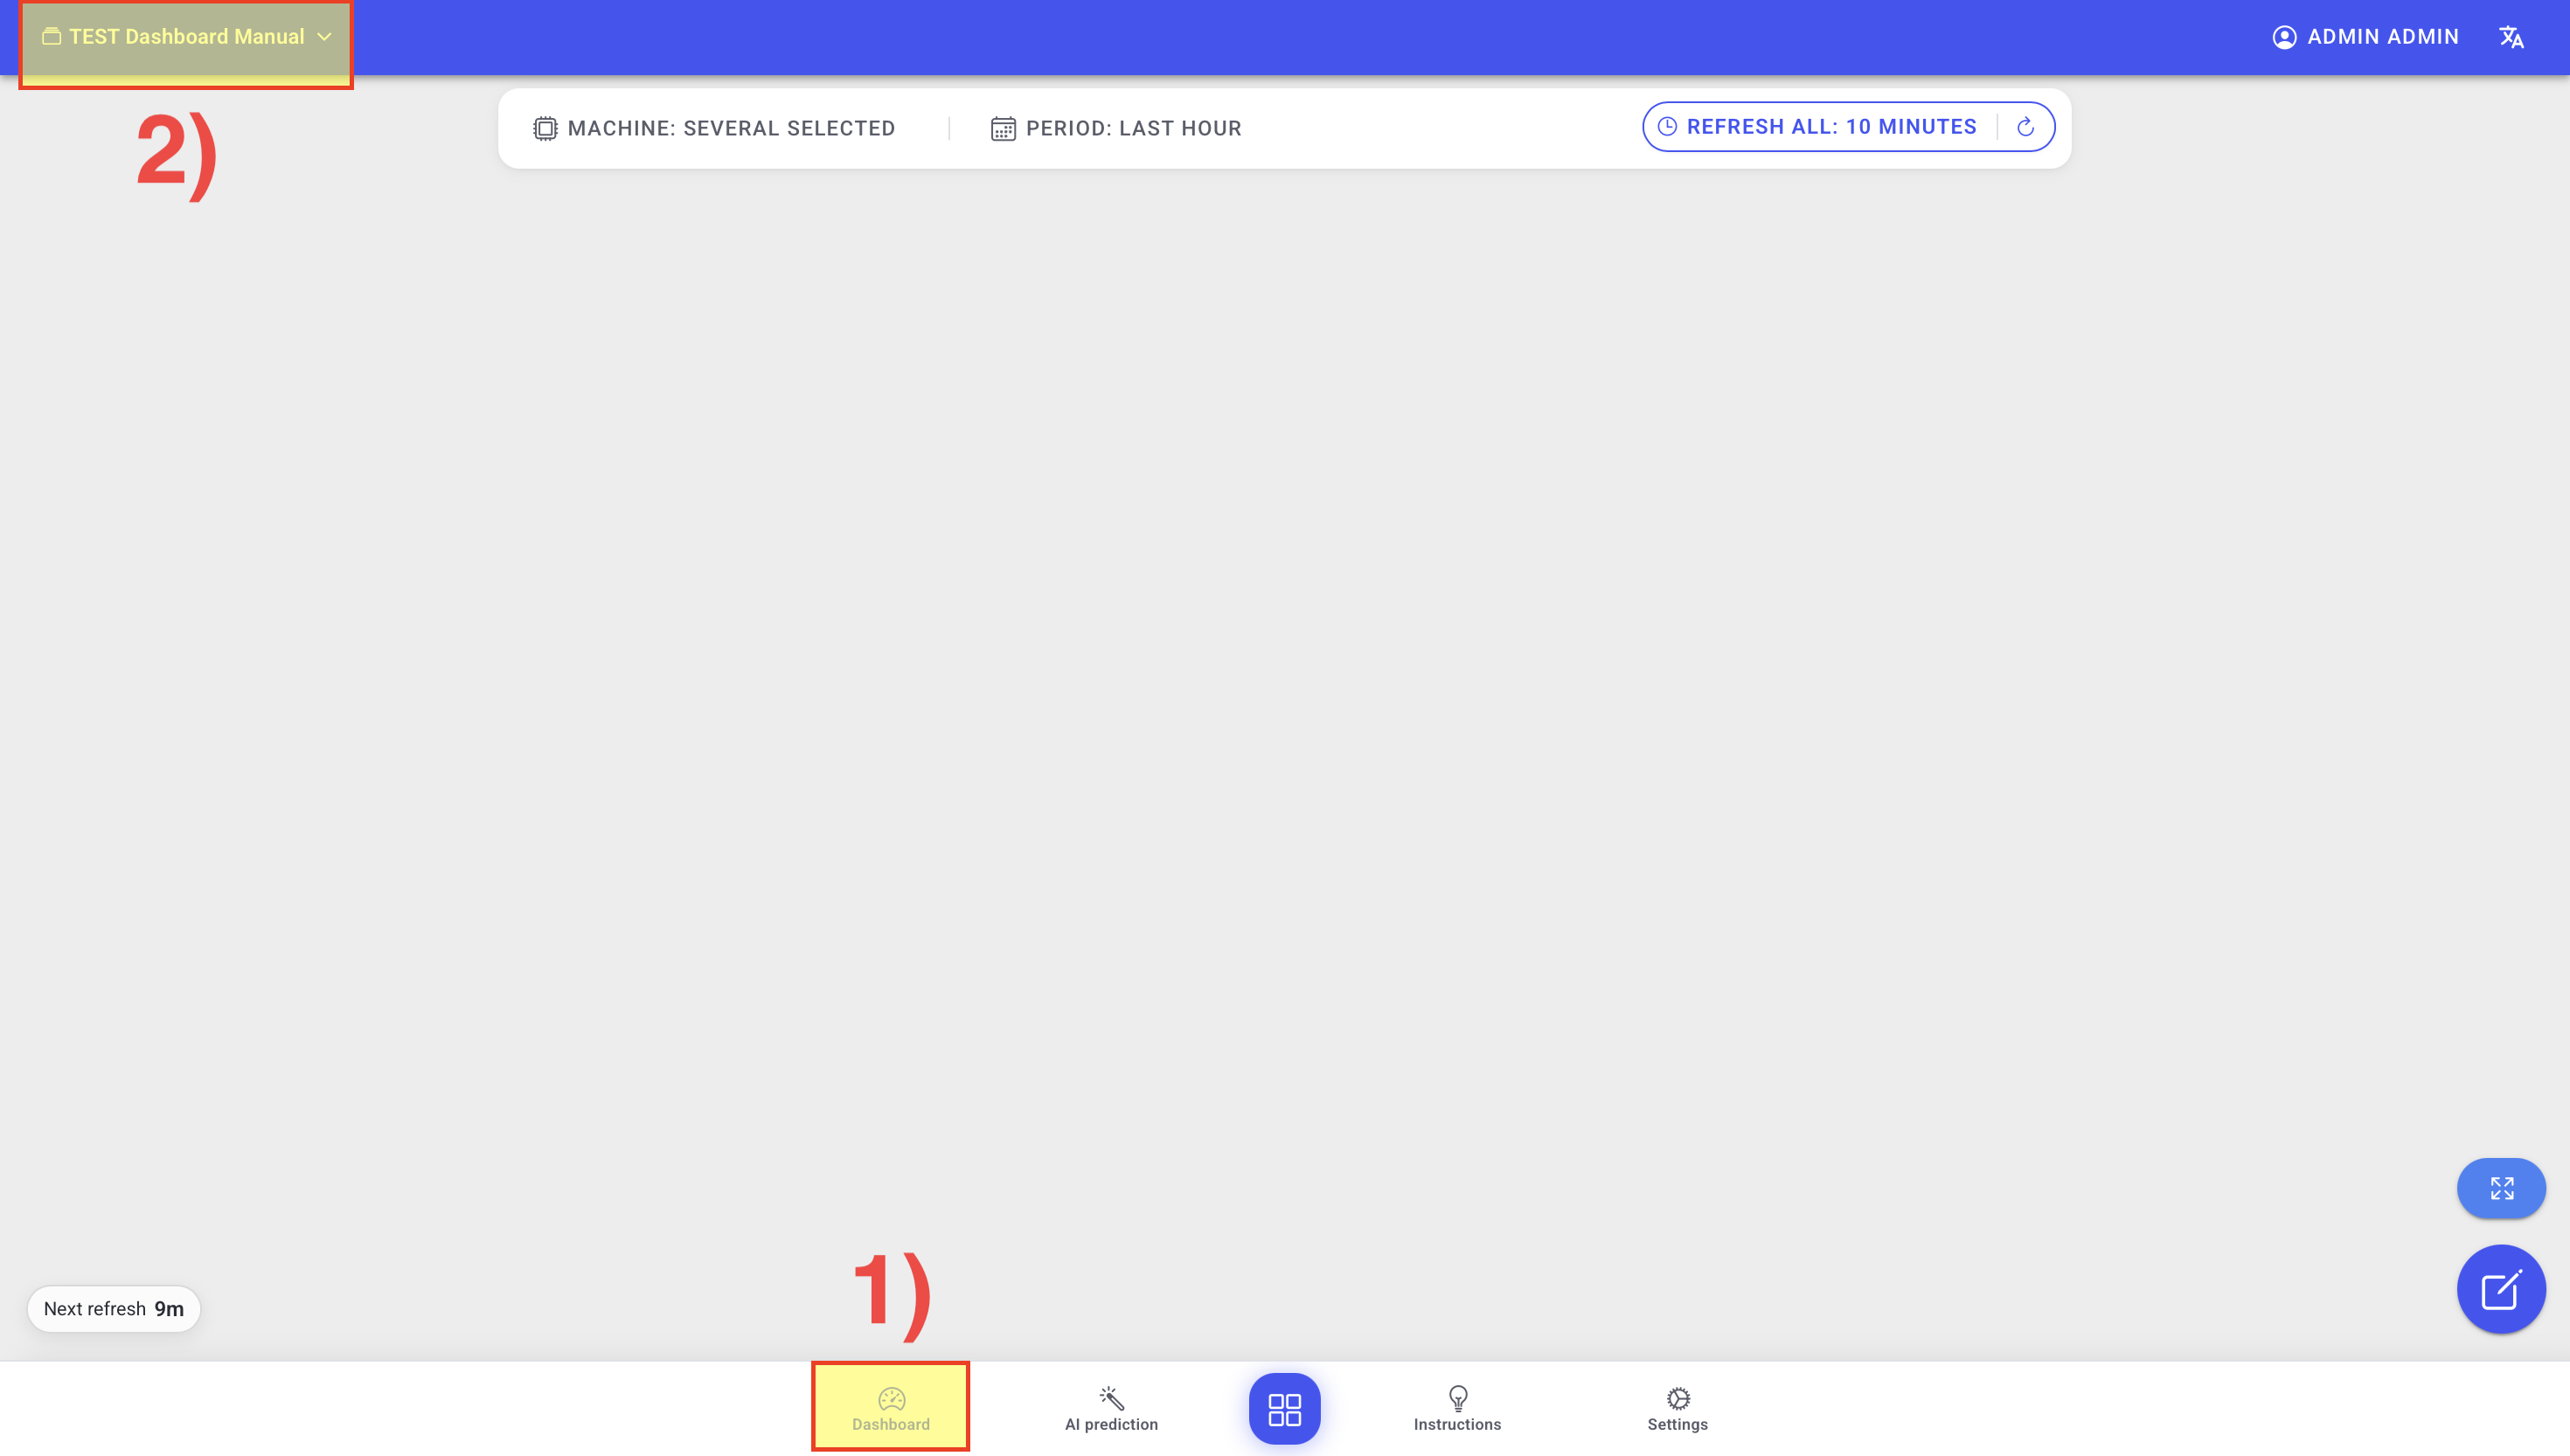
- Open the dashboard selector.
- Select Add.
- Enter a dashboard name.
- Select Confirm.
Menu path example: Dashboard > Dashboard selector > Add > Confirm
Example (dashboard selector, layout may vary by deployment):
Steps (add widgets)
- Open App > Dashboard.
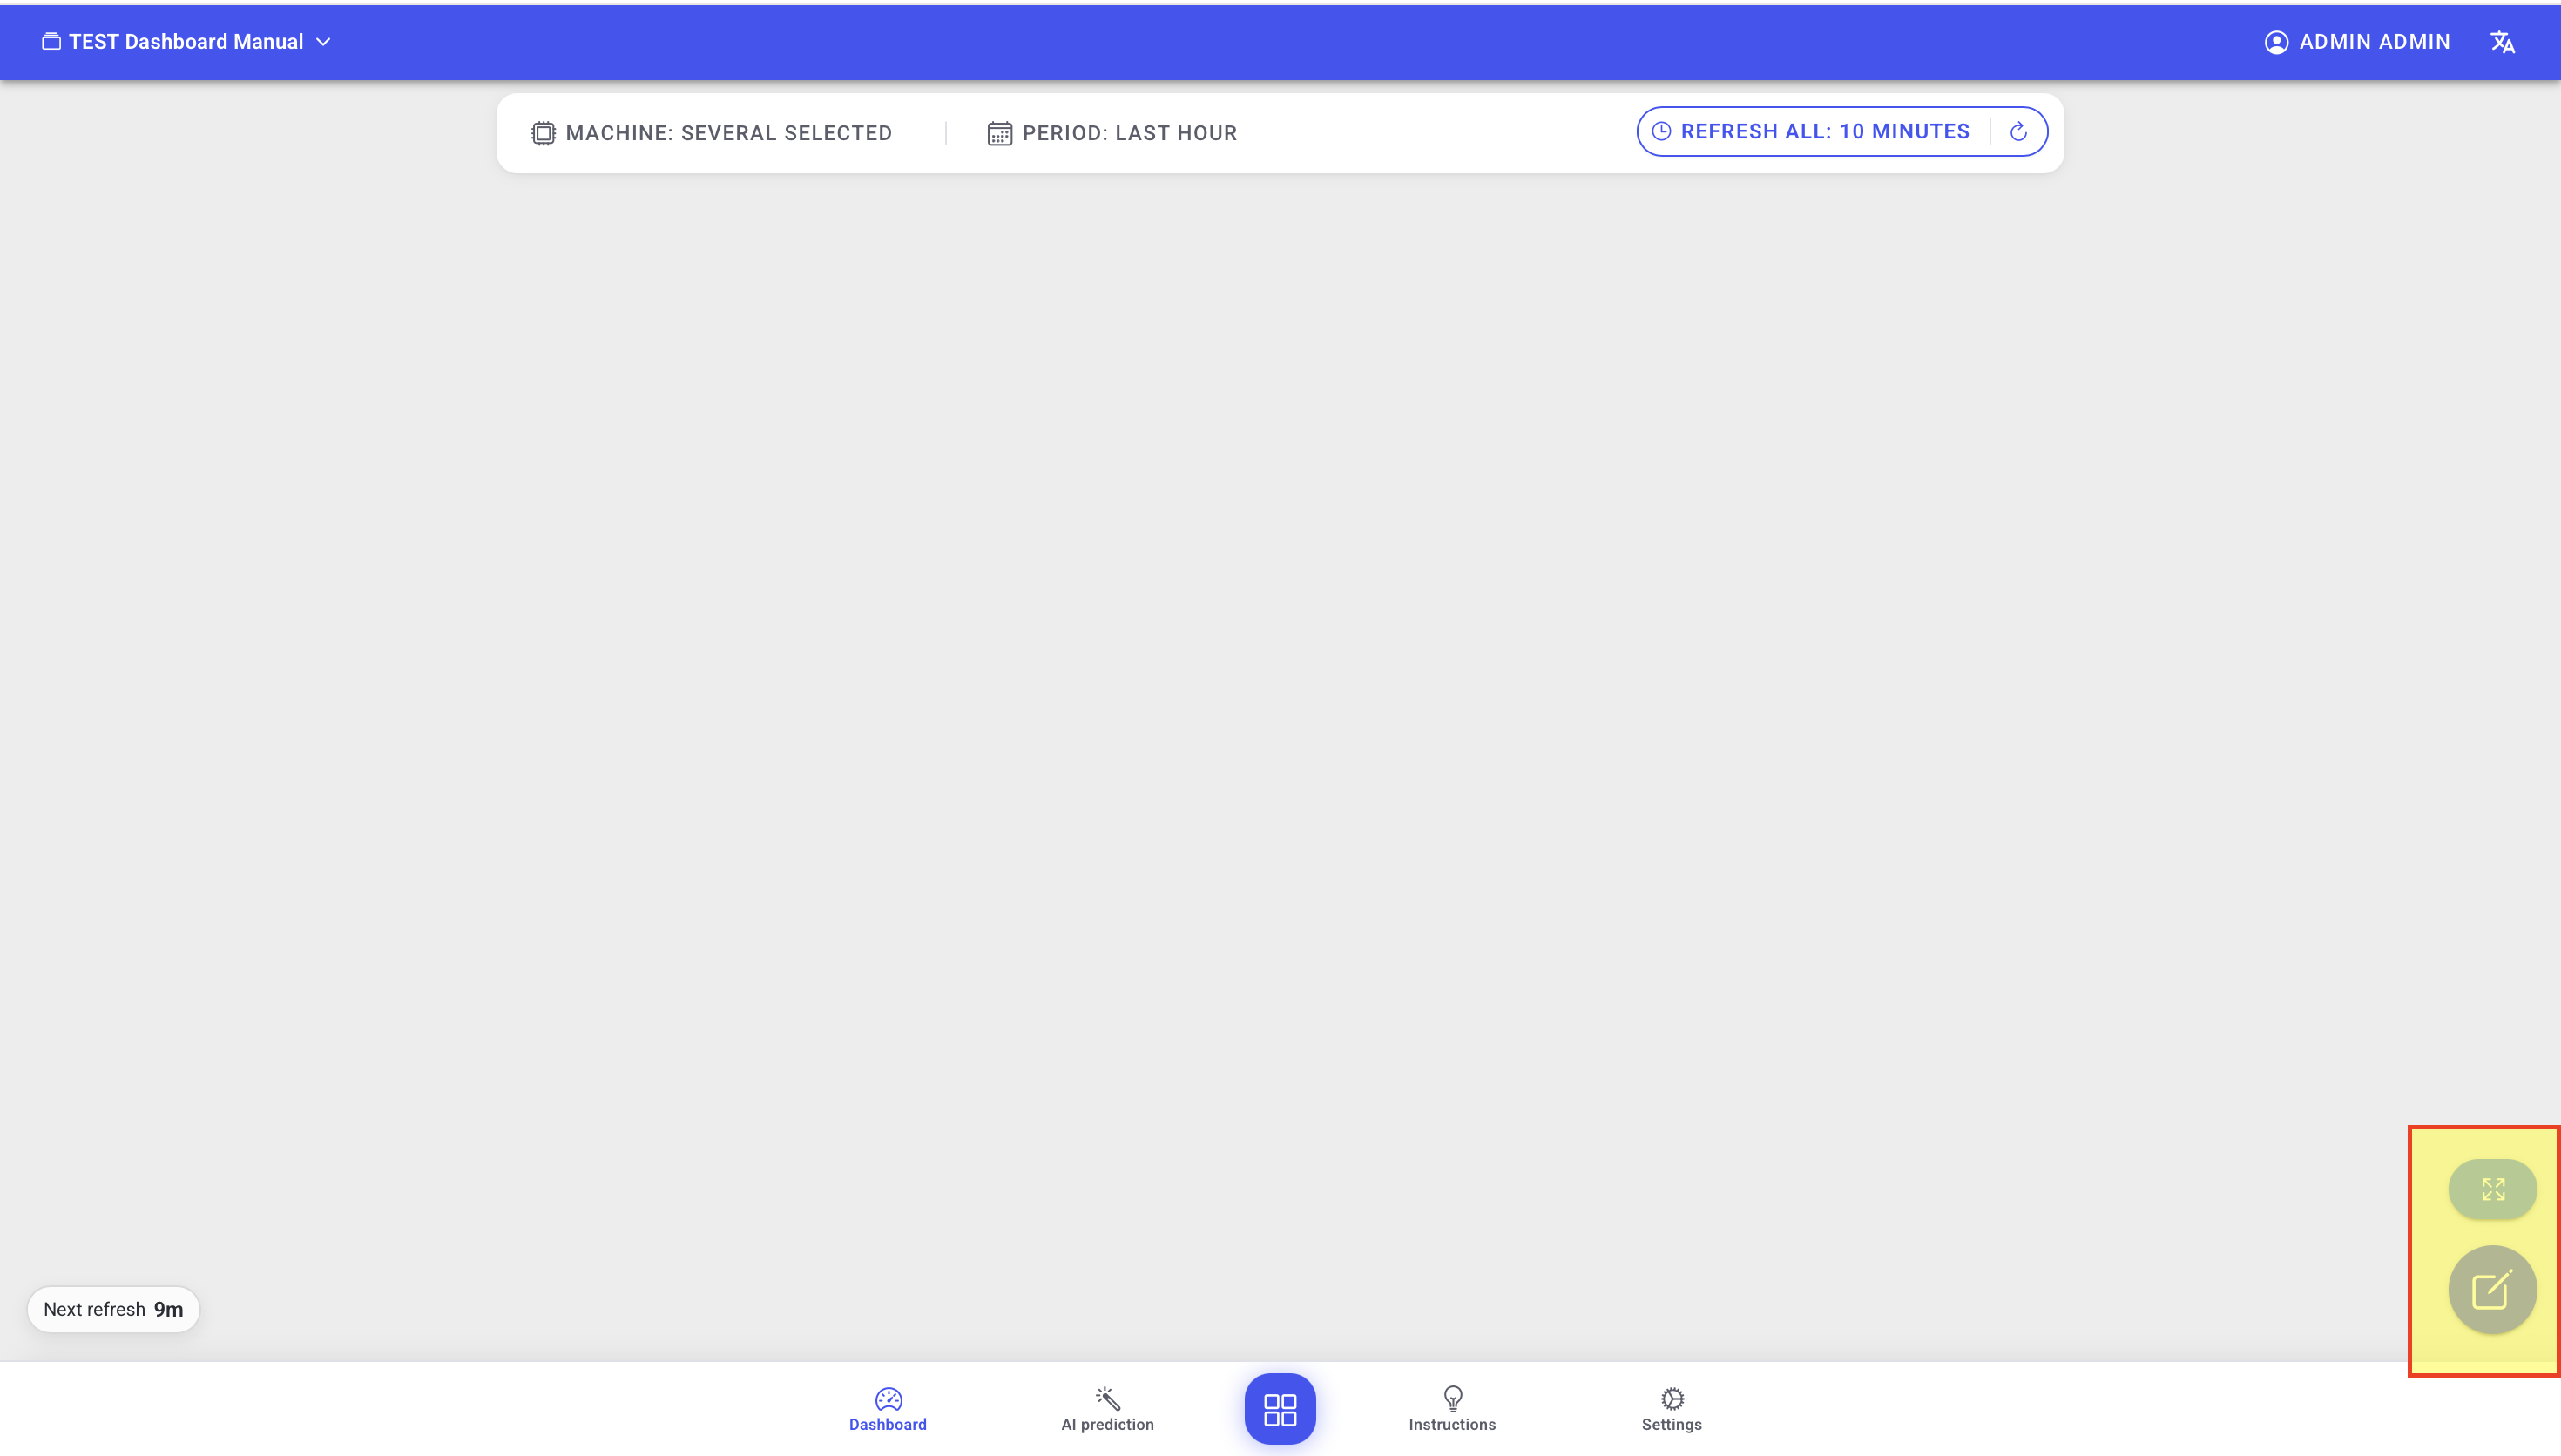
- Enter edit mode (often a pencil or Edit button).
- Select Add widgets (often a plus button).
- Browse widgets by category (for example: Errors, Performance metrics, Scrap).
- Select the widgets you want, then select Add to confirm.
Example (edit controls, layout may vary by deployment):
Steps (move and resize widgets)
- Enter edit mode.
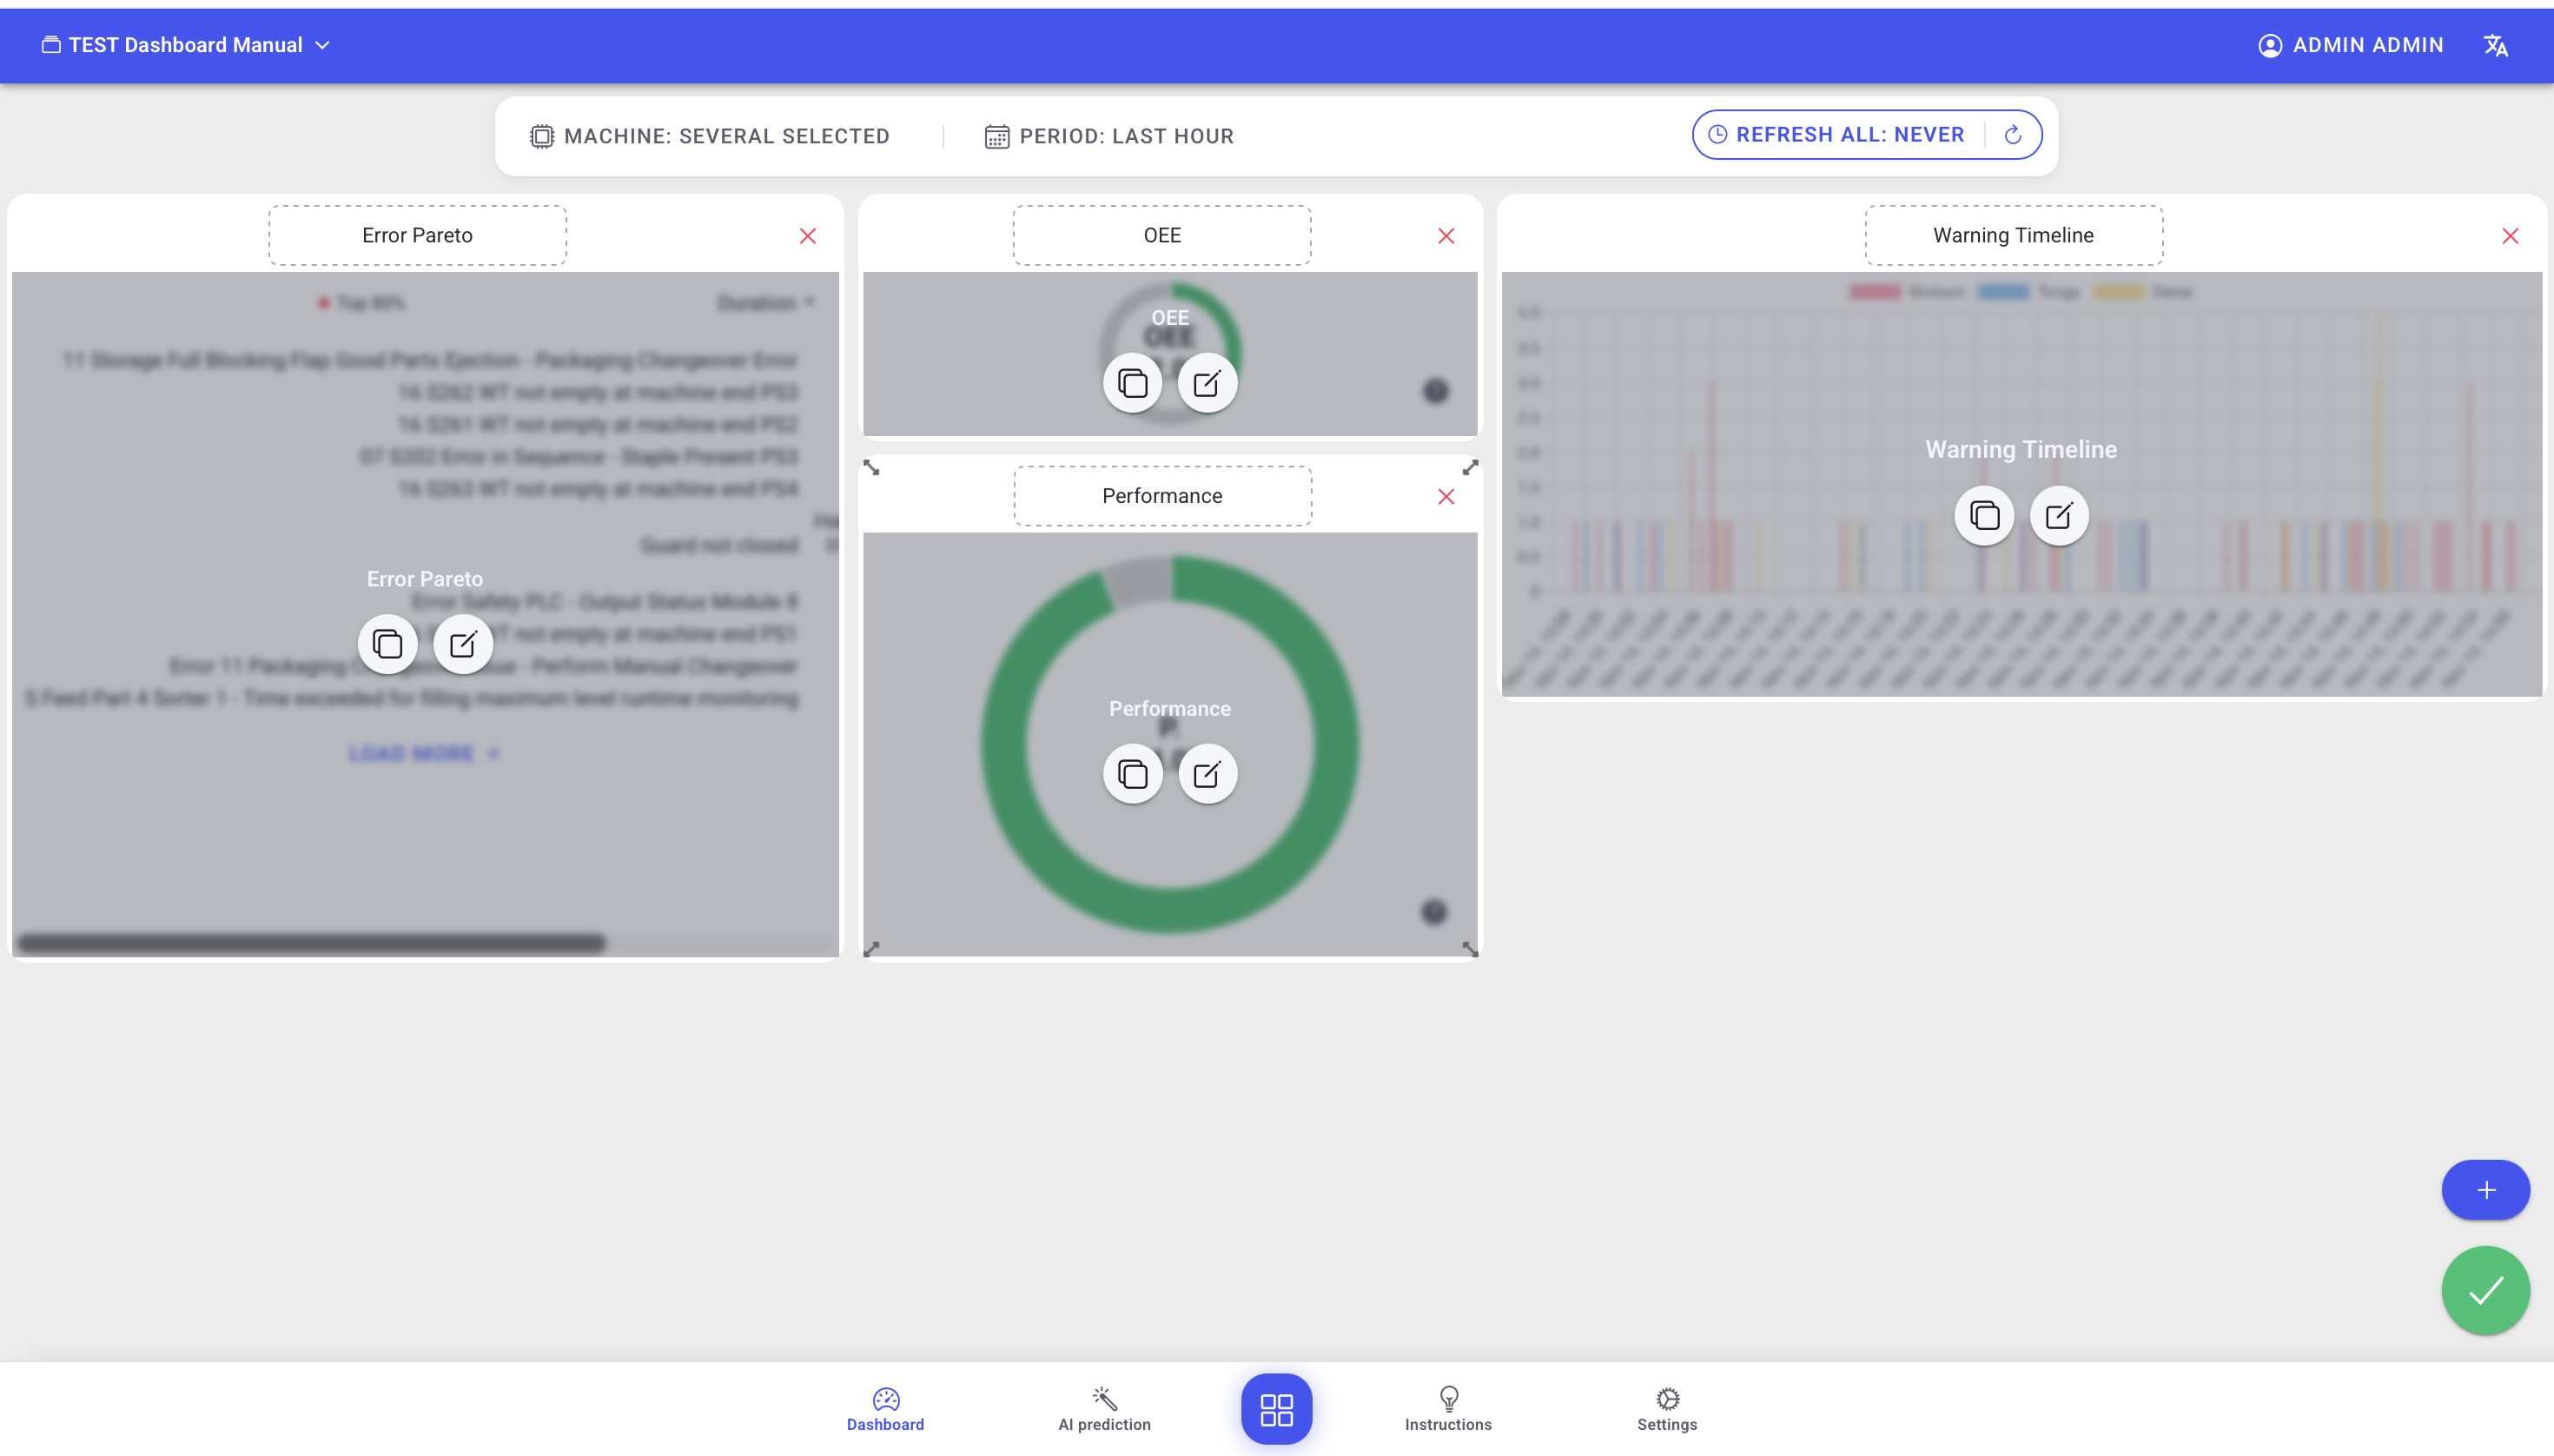
- Drag widgets to reposition them.
- Resize widgets by dragging edges or corners (grid-aligned).
- Select Save (often a checkmark) to store the layout.
Example (edit mode, layout may vary by deployment):
Widget locks (machine and time)
By default every widget follows the global machine and time filters in the dashboard header. You can override this per widget so a single widget stays on its own machine and/or time range while the rest of the dashboard keeps following the global selection.
Set a lock
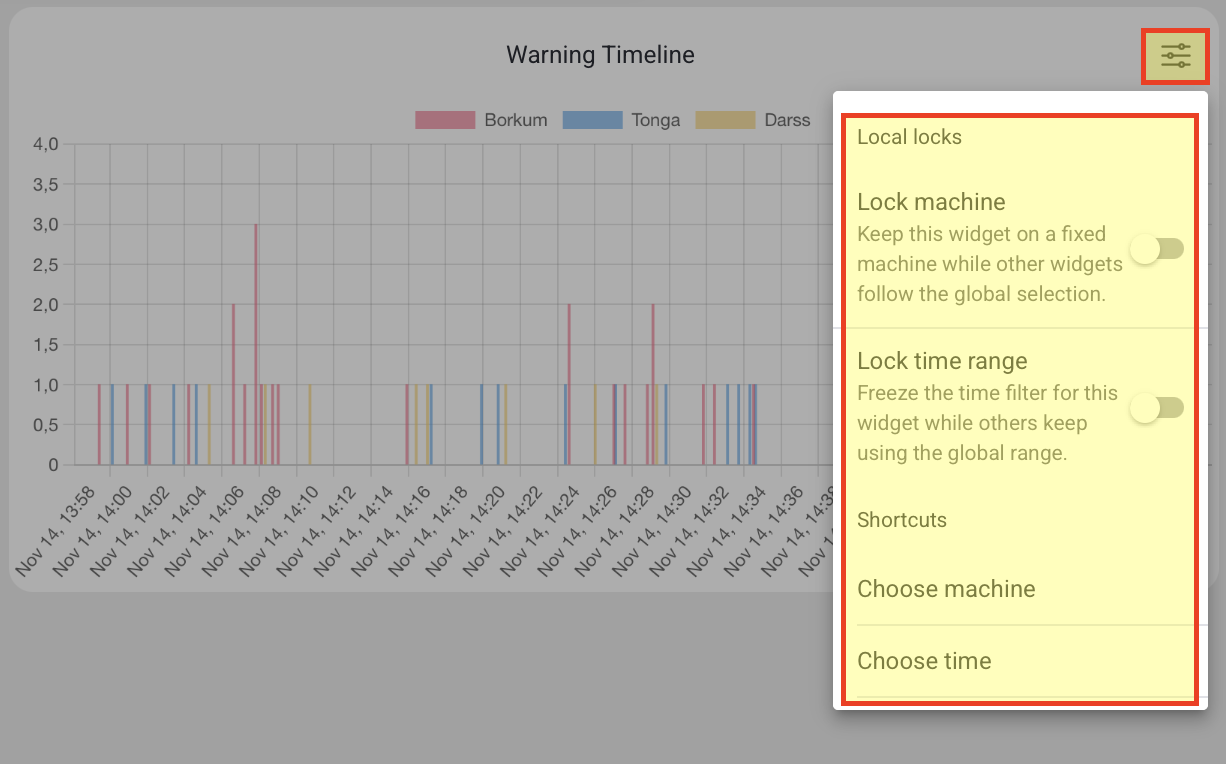
Open the widget's filter menu (the slider icon in the widget header). Under Local locks you have two toggles:
- Lock machine — Keep this widget on a fixed machine while other widgets follow the global selection.
- Lock time range — Freeze the time filter for this widget while others keep using the global range.
When a lock is on, you choose the machine and/or time that this widget should use.
Example (widget filter menu with the local locks, names may vary):
How you recognize a locked widget
A locked widget shows small lock indicators in its header and prints its own machine and time under the title, so you can tell at a glance that it is not following the global filters:
- a machine lock icon (the widget stays on the shown machine), and/or
- a time lock icon (the widget stays on the shown period).
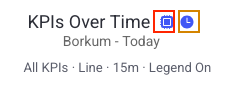
In the example above, the widget is locked to machine Borkum and period Today regardless of what the dashboard header is set to.
What users see
- A dashboard selector (often in the top-left header area).
- Edit mode controls and a widget selection dialog.
- Widget cards with a short description and selection state.
- A widget settings menu per widget (if enabled).
- When you add new widgets, they are inserted at the bottom of the grid first, so the existing layout stays stable.
Best practices
- Standardize dashboards per role so shifts work consistently.
- Keep critical widgets (status + alerts) visible without scrolling.
- Use widget locks sparingly to avoid confusion about which filters apply.
Troubleshooting
- You cannot enter edit mode -> Missing permission -> Ask an admin to review your role permissions -> Use a shared standard dashboard until access is granted
- A widget shows a different machine/time than expected -> Widget is locked to a machine or time -> Open widget settings and remove locks -> Escalate to a supervisor if you cannot change widget settings