How to Read Predictions
Purpose
Understand what each prediction means so you can prioritize attention and act appropriately.
What a prediction typically includes
- Title: short name of the potential upcoming issue.
- Probability scores:
- AI probability: an AI-based confidence that this issue is likely to occur next.
- Statistical probability: a data-based value derived from historical frequency (no AI interpretation).
- Actions:
- Help: opens matching guidance suggestions
- Analysis: opens historical error analysis
- Ignore: available only if your role allows ignoring messages
Prediction cards
Many deployments show prediction cards with a visual hierarchy:
- the highest-probability item is highlighted (often a "primary" card)
- additional predictions can be selected from a chart and shown as secondary cards
Card colors and exact behavior can vary by deployment.
Example (names and layout may vary by deployment):
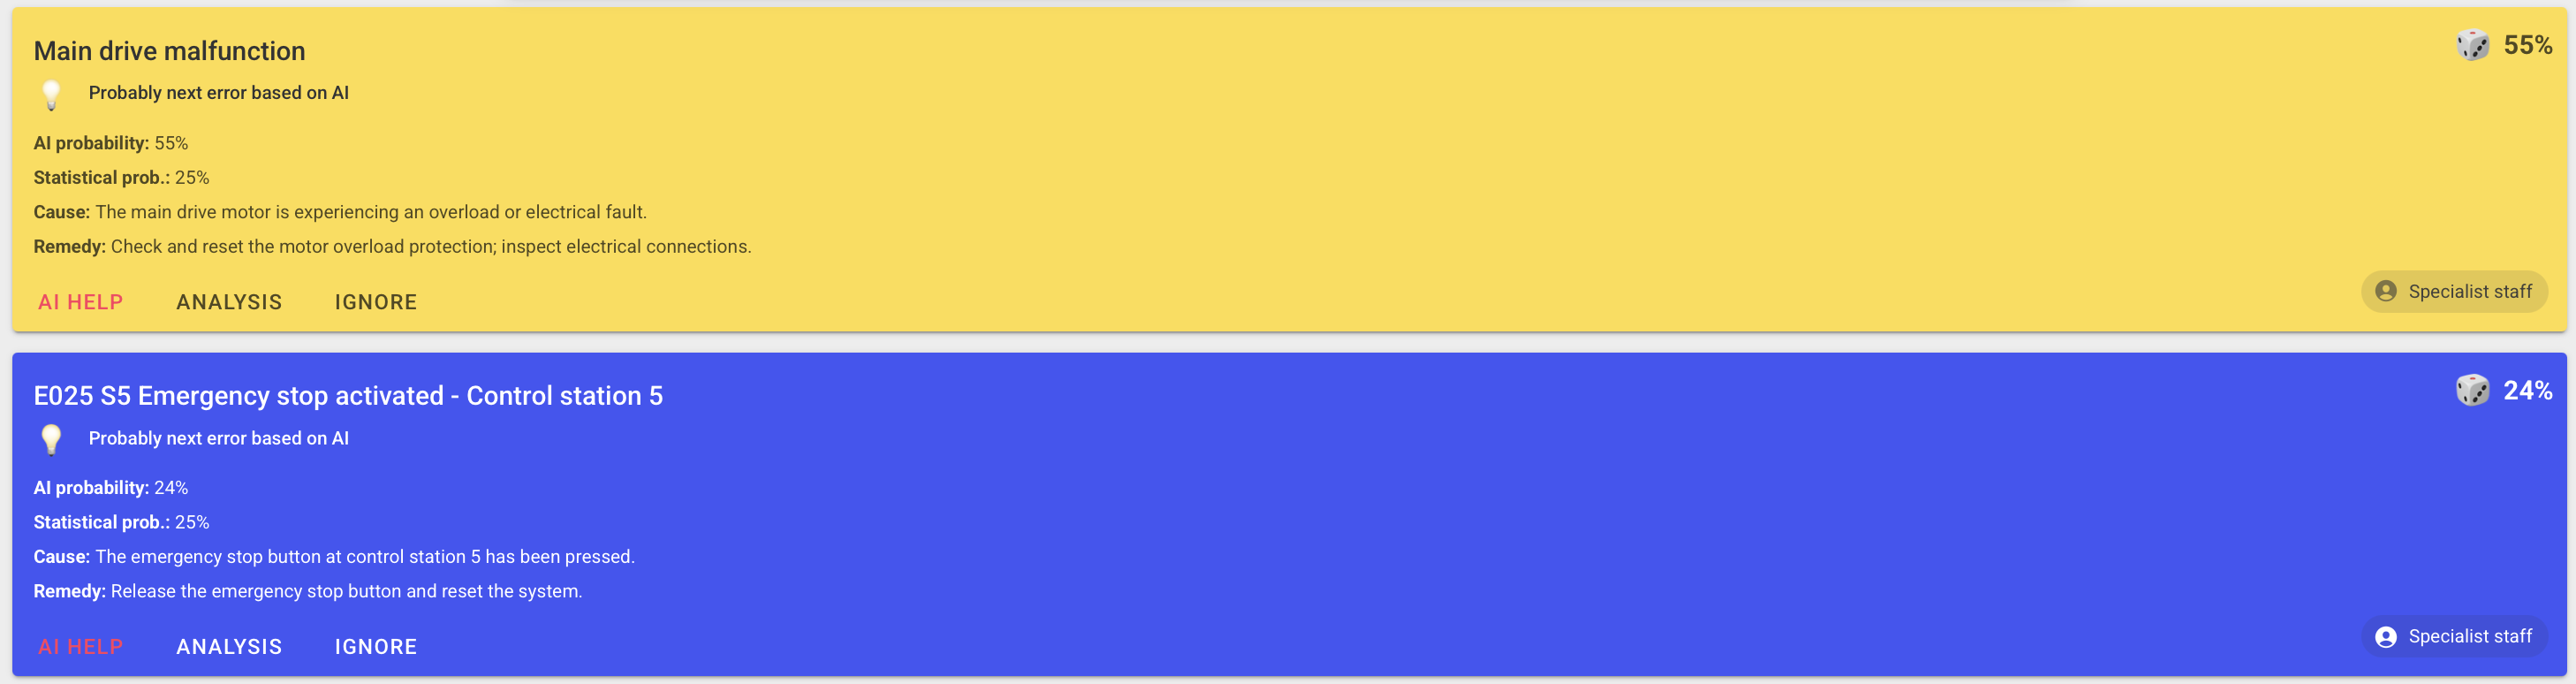
Error prediction chart
A bar chart may appear below the cards to compare potential upcoming issues.
Depending on your deployment, the chart can show:
- statistical probability vs. AI recommendation (often using different bar colors)
- the currently selected prediction (highlighted)
- exact probability values on hover or tap
Best practices
- Treat predictions as guidance, not an automatic decision.
- Use the Analysis view to validate whether the prediction matches historical behavior.
- Use Help when you want to look for existing guidance before drafting a new procedure.
Troubleshooting
- A prediction does not make sense -> Filters/machine selection mismatch or data patterns changed -> Verify machine and time range, then re-check -> Escalate with the prediction title and selected machine
- Probabilities look inconsistent -> Different probability types are shown (AI vs statistical) -> Compare both values and use Analysis for context -> Escalate if values look obviously wrong for known machine behavior