Good Parts
Category: Performance Metrics · Widget ID: oee.good-parts
What it shows
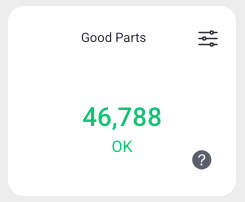
Shows the number of good parts (GP) produced by the machine in the selected timeframe.
Data and refresh
- Data source: OEE / parts counter service.
- Time range: Respects the selected time period (aggregated over the whole window).
- Machine filter: Respects the selected machine(s).
- Widget locks: You can lock this widget to its own machine and/or time range (Machine lock / Time lock) so it ignores the dashboard filters. See Custom Dashboard.
Configuration
This widget has no additional settings; it follows the dashboard machine and time filters.
How to read it
A single large number: the total good parts in the selected period for the selected machine.
Interactions
- Help/info — view how the count is defined.
Screenshot
Troubleshooting
Widget shows no data -> No events in the selected machine/period, or a filter is too narrow -> Widen the time range or change the machine, then refresh once -> If a machine that normally reports data stays empty, use Troubleshooting > Connectivity.
See also (expected behaviour): why the counter and the Produced Parts Over Time total can differ, and why the counter may not move right after Refresh.