Machine Status Distribution
Category: Machine Status · Widget ID: status.aggregate
What it shows
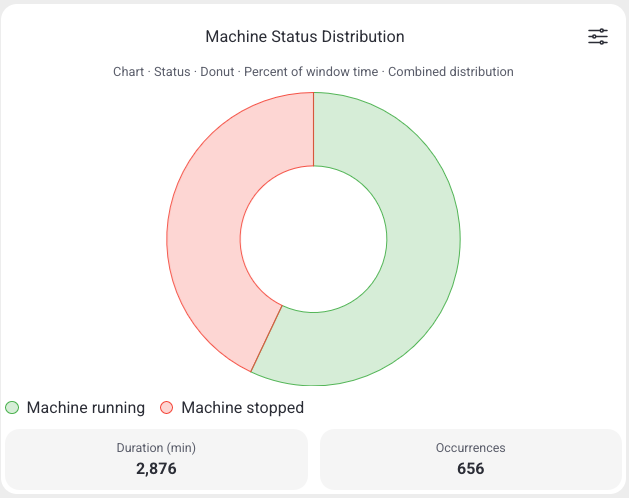
Shows the aggregated machine states for the selected period — how much time the machine spent in each state — as a chart or a table.
Data and refresh
- Data source: Reports API.
- Time range: Respects the selected time period (aggregated over the whole window).
- Machine filter: Respects the selected machine(s).
- Widget locks: You can lock this widget to its own machine and/or time range (Machine lock / Time lock) so it ignores the dashboard filters. See Custom Dashboard.
Configuration
Open the widget's filter menu (slider icon), then select Configure to change:
- Visualization: Chart view or Table view
- Chart type: Donut or Stacked horizontal bar
- Breakdown: Status, Running state, or Planned downtime state
- Value metric: Percent of window time, Duration (min), or Occurrences
- Split by machine and Status filter
- Show legend
How to read it
Each state gets a share of the total period. In table mode you also see absolute durations. Use it to quantify where time is lost.
Interactions
- Widget filter (top-right icon) — open the widget's own settings to change its display.
Screenshot
Troubleshooting
Widget shows no data -> No events in the selected machine/period, or a filter is too narrow -> Widen the time range or change the machine, then refresh once -> If a machine that normally reports data stays empty, use Troubleshooting > Connectivity.