Yield per Productive Time
Category: Performance Metrics · Widget ID: oee.yield-per-time
What it shows
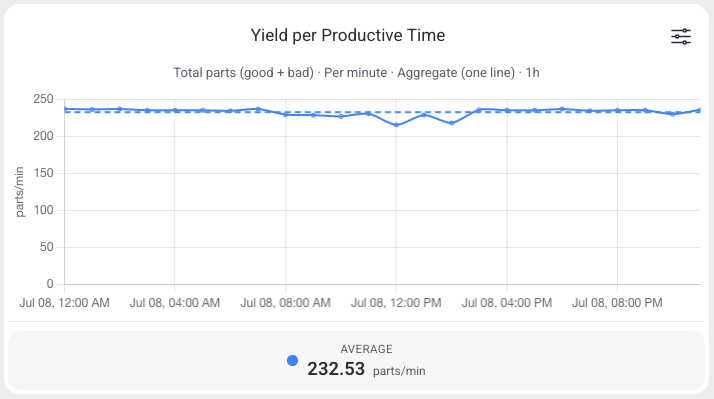
Shows produced parts per active production time over the period, with a time-weighted period average shown as a reference line and as a value below the chart. Introduced in app v9.41.0.
Data and refresh
- Data source: Reports API (time series).
- Time range: Respects the selected time period (plotted across the window).
- Machine filter: Respects the selected machine(s).
- Widget locks: You can lock this widget to its own machine and/or time range (Machine lock / Time lock) so it ignores the dashboard filters. See Custom Dashboard.
Configuration
Open the widget's filter menu (slider icon), then select Configure to change:
- Parts basis: Total parts (good + bad), Good parts, or Bad parts
- Time unit: Per minute or Per hour
- Machine grouping: Aggregate (one line) or Per machine
- Chart type: Line or Bar
- Bucket: time resolution
- Show average (reference line) and Show legend
How to read it
Each bar/point is the yield (parts per active time) for a bucket; the reference line and footer value give the average across the whole period. Use it to judge output efficiency independent of downtime.
Interactions
- Widget filter (top-right icon) — open the widget's own settings to change its display.
Screenshot
Troubleshooting
Widget shows no data -> No events in the selected machine/period, or a filter is too narrow -> Widen the time range or change the machine, then refresh once -> If a machine that normally reports data stays empty, use Troubleshooting > Connectivity.