Machine Alerts Live
Category: Warnings · Widget ID: machine.alert-live
What it shows
Shows active errors and warnings in real time, independent of the selected time range — the live to-do list for the machine right now.
Data and refresh
- Data source: Live alerts stream (real-time).
- Time range: Live — always shows real-time data and ignores the selected time period and the dashboard refresh interval.
- Machine filter: Respects the selected machine(s).
- Widget locks: You can lock this widget to its own machine and/or time range (Machine lock / Time lock) so it ignores the dashboard filters. See Custom Dashboard.
Configuration
Open the widget's filter menu (slider icon), then select Configure to change:
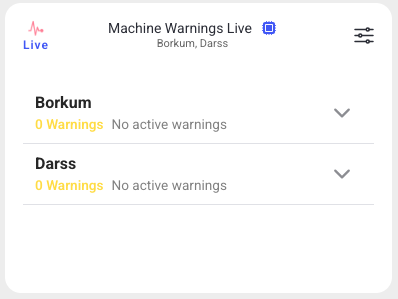
- Show: Errors and warnings, Errors only, or Warnings only
How to read it
A live list of currently active errors/warnings. Because it is live, it updates on its own and ignores the dashboard time filter.
Interactions
- Widget filter — choose alert scope.
- Updates automatically.
Screenshot
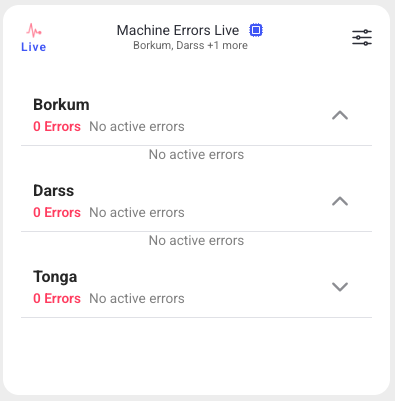
The same widget can be configured to show warnings instead:
Troubleshooting
Widget shows nothing -> No live connection or the machine is not reporting -> Confirm the machine is online -> If it stays empty, use Troubleshooting > Connectivity with the machine name.