Dashboard
Purpose
Use the dashboard as the primary operational overview for production status.
Steps
- Open App > Dashboard.
- Select the dashboard layout you want to use (if multiple are available).
- Set the filters (machine and time period) to match what you want to review.
- Review widgets and respond to alarms or anomalies.
Menu path examples (names may vary by deployment):
- Dashboard > Dashboard selector > Select
- Dashboard > Machine selector > Select
- Dashboard > Time period > Select
- Dashboard > Refresh > Refresh now
What users see
Example (layout and widgets vary by deployment and dashboard configuration):
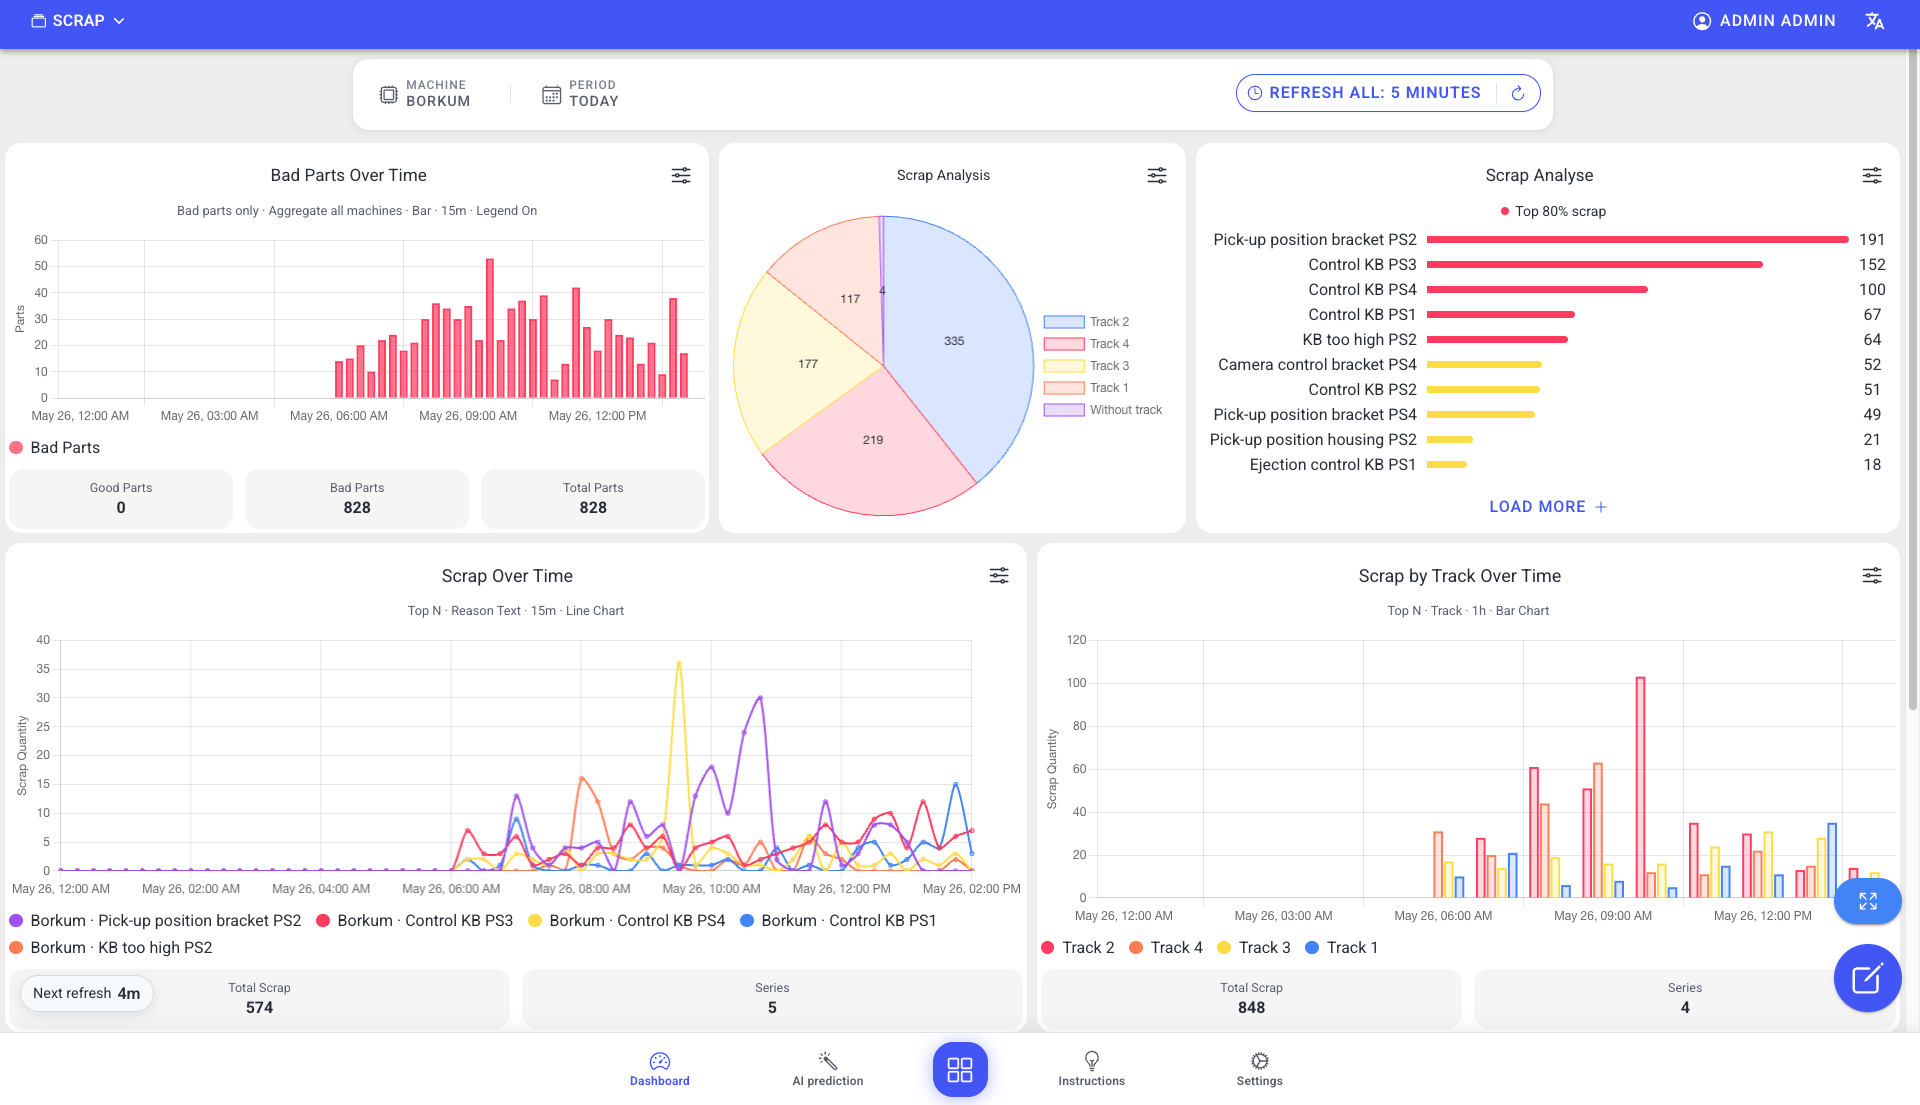
- A header with navigation and user controls.
- Filter controls for machine and time period.
- Widgets for status, KPIs, trends, and alerts.
Understanding the header and filters
The dashboard header typically contains:
- Dashboard selector: switch between existing dashboards or create a new one (if enabled).
- Profile / user menu: open profile information and sign out.
- Language selector: choose your preferred language.
Below the header, you usually find filters that control what most widgets display:
- Machine selector: choose a specific machine or line.
- Time period and batch selector: choose a predefined window or a custom time period and (if available) a batch.
- Refresh control: see Refresh logic below.
Refresh logic
The Refresh all control on the right of the filter bar decides how often the whole dashboard reloads its data automatically.
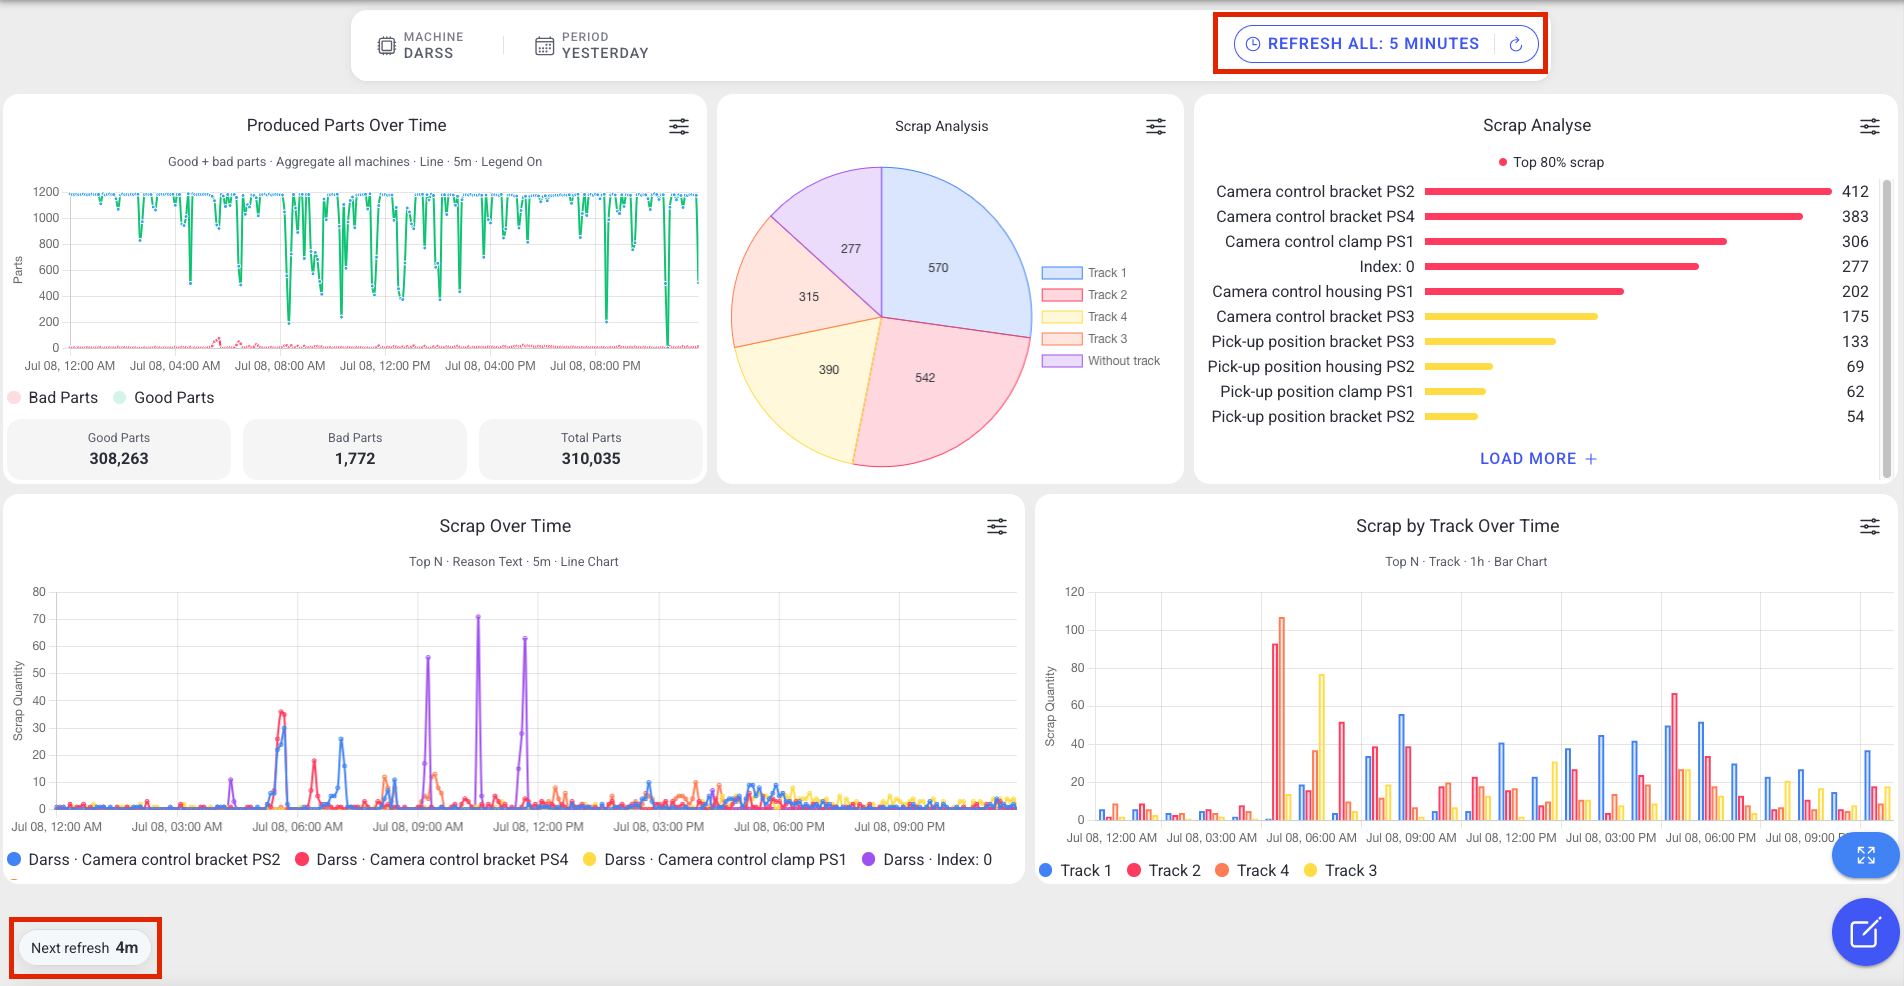
- Auto-refresh interval — open Refresh all and choose 5 minutes, 10 minutes, 30 minutes, or Never. With Never, the dashboard only updates when you refresh it manually.
- Manual refresh — the refresh button next to the interval reloads every widget immediately, without waiting for the next cycle.
- Next refresh countdown — a Next refresh indicator (for example "4m") shows the time remaining until the next automatic refresh.
- Applies to the whole dashboard — one interval drives all time-based widgets at once.
What refresh does to the time window
How the time window moves on each refresh depends on the period you picked (see Change Time Range):
- Fixed end time — the end time stays put on refresh (the window does not move); data inside it is re-fetched.
- Current time — the end time follows the current time on refresh, so a live window keeps sliding forward.
Live widgets are independent
Some live widgets (Machine Status Live, Machine Alerts Live) ignore the selected time range and the refresh interval — they always stream real-time data and update on their own.
Working with widgets and dashboards
If your deployment supports custom dashboards, you can:
- add and remove widgets
- move and resize widgets on a responsive grid
- apply widget-level settings (for example a machine lock or time lock)
- create multiple dashboards tailored to teams, roles, or machines
For step-by-step dashboard customization, see: Custom Dashboard
Common widget types include:
- Machine status: timeline, live status, live alerts, over-time, and distribution views
- Performance metrics: OEE, Performance, Availability, Quality, Good Parts, and Bad Parts
- Time-based trends: produced-parts trends and KPI trends across the selected time range
- Scrap: scrap analysis, scrap summary, and scrap-over-time views
- Errors and warnings: dedicated Pareto, history, and timeline widgets per message type
- Process metrics: aggregated summaries and time series trends
Widget library
There is one page per widget, all following the same structure. Widgets are grouped by the same categories used in the app's widget catalog.
Machine Status
Performance Metrics
- OEE
- Performance
- Availability
- Quality
- Good Parts
- Bad Parts
- Produced Parts Over Time
- KPIs Over Time
- Yield per Productive Time
Process Metrics
Scrap
Errors
Warnings
Related interaction:
Best practices
- Use role-specific dashboards (operator vs. supervisor vs. maintenance).
- Keep dashboards focused: fewer widgets, but always the ones your shift relies on.
- Review filters before acting on a widget (machine + time period).
Troubleshooting
If data appears stale:
- Widgets do not update or show unexpected values -> Filters are set incorrectly or refresh is paused -> Re-check machine/time filters, refresh once manually, then wait for the next refresh cycle -> If the issue persists, use Troubleshooting > Connectivity and include the machine and time window you selected