Process Metrics (Time Series)
Category: Process Metrics · Widget ID: process-metrics.timeseries
What it shows
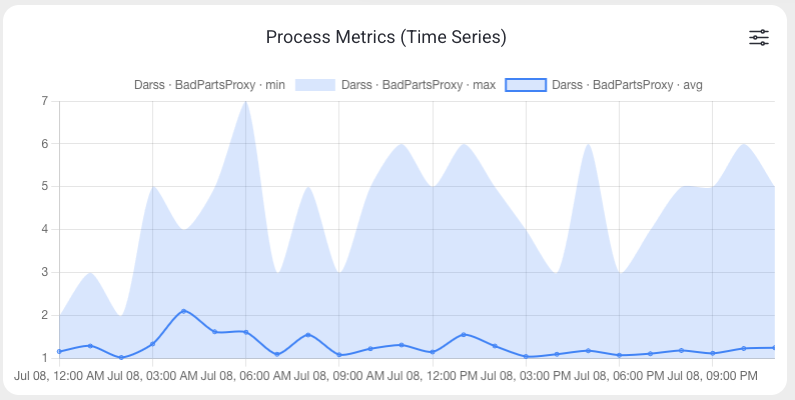
Shows one or more process metrics over time with configurable aggregation and grouping — for custom machine signals beyond the standard KPIs.
Data and refresh
- Data source: Reports API (time series).
- Time range: Respects the selected time period (plotted across the window).
- Machine filter: Respects the selected machine(s).
- Widget locks: You can lock this widget to its own machine and/or time range (Machine lock / Time lock) so it ignores the dashboard filters. See Custom Dashboard.
Configuration
Open the widget's filter menu (slider icon), then select Configure to change:
- Metrics: select one or more process metrics
- Aggregation: avg, min, max, or sum
- Resolution: time bucket width
- Chart type: Line or Bar
- Group by (e.g. machine or sub-type)
- Show legend, Show min/max, Fill missing with zero
How to read it
Each series is a process metric over time. Grouping controls whether machines/sub-types are separate series.
Interactions
- Widget filter (top-right icon) — open the widget's own settings to change its display.
Screenshot
Troubleshooting
Widget shows no data -> No events in the selected machine/period, or a filter is too narrow -> Widen the time range or change the machine, then refresh once -> If a machine that normally reports data stays empty, use Troubleshooting > Connectivity.