OPC UA Connections
Purpose
Use OPC UA Connections to link the app to your machine data sources. A connection ties one machine to one OPC UA endpoint (server) and a set of NodeIDs (the values to read). The connector service then translates those values into machine status, errors, warnings, and process metrics that appear on the Dashboard.
This area is infrastructure-critical and is typically restricted to authorized technical personnel (commissioning, administrators, or support).
Key concepts
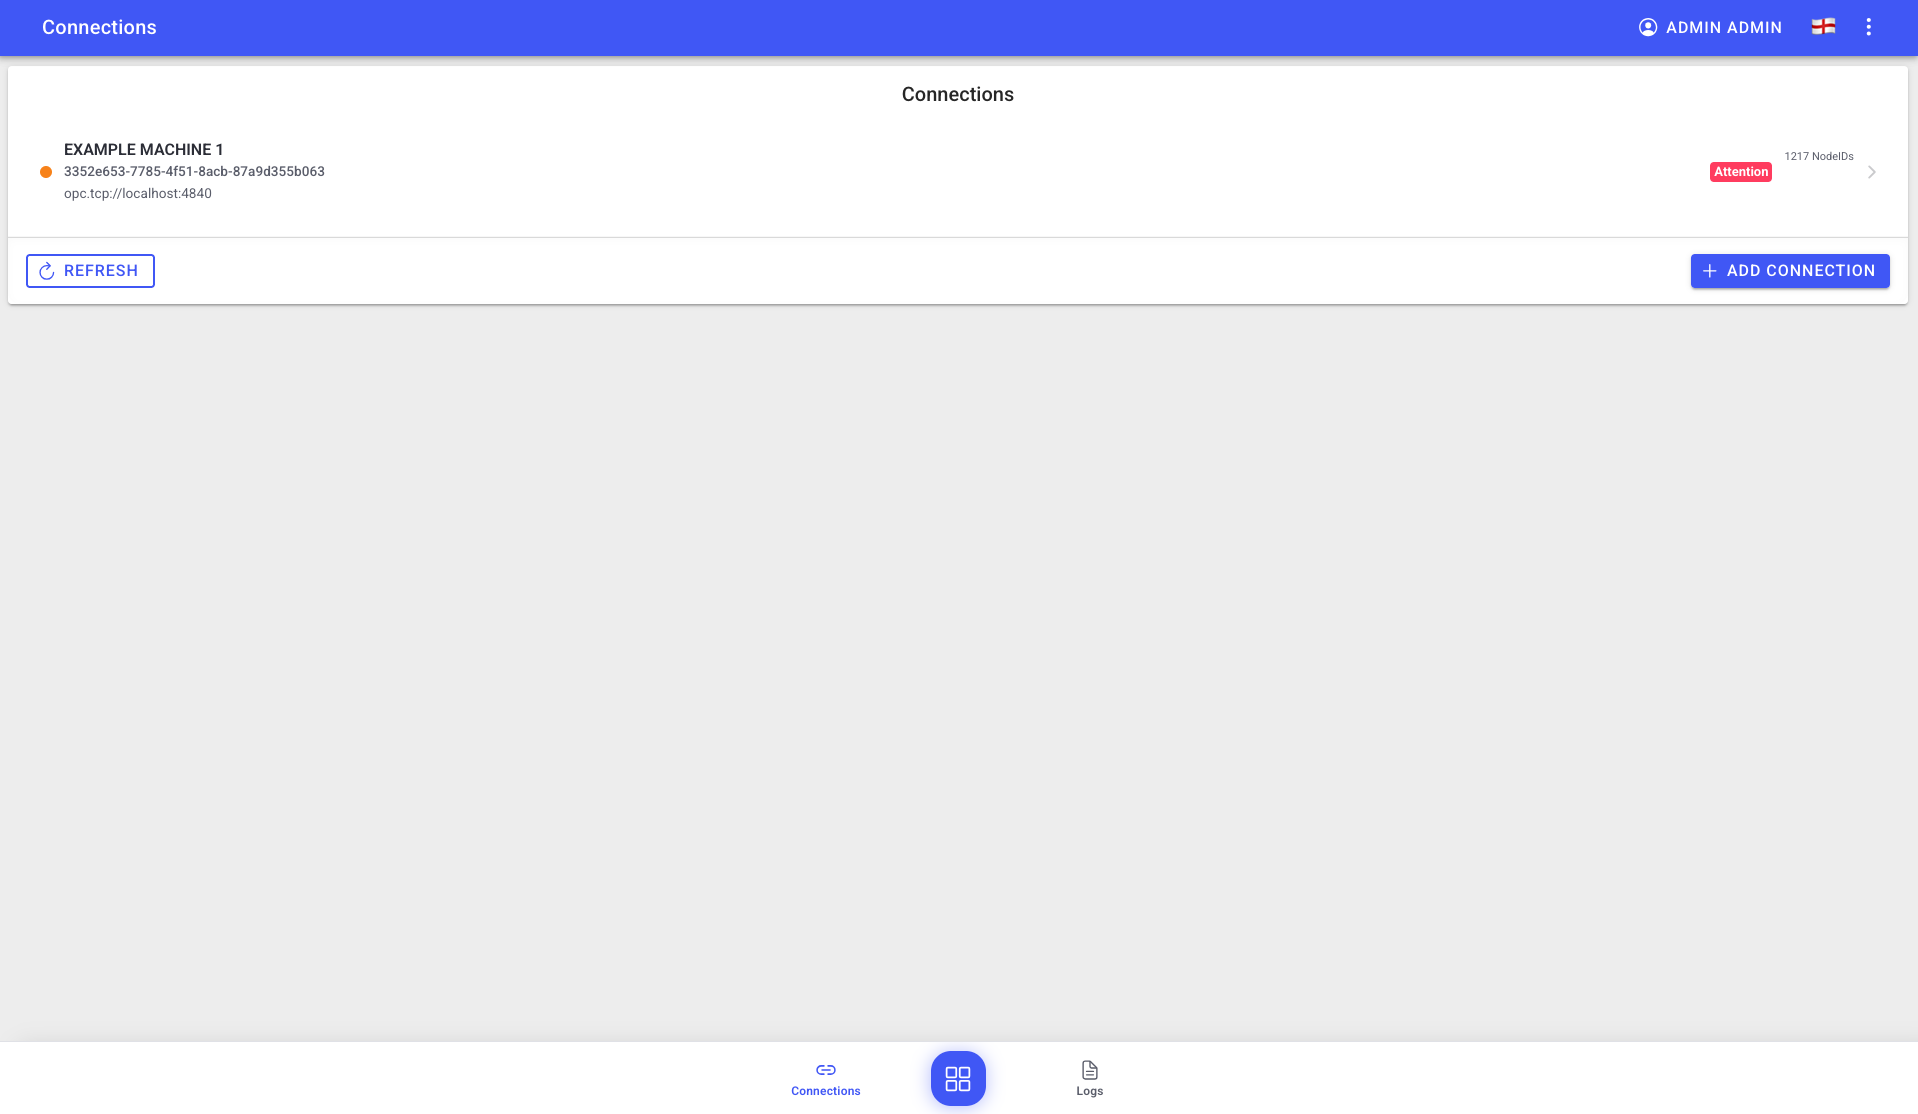
- Connection — a machine paired with an endpoint. Shown as a card in the connections list with its NodeID count and status badges.
- Endpoint — the OPC UA server the connector talks to (URL, security settings, timestamp preference).
- NodeID — a single value on the server, mapped to a tag the app understands (status, error, warning, counter, process metric).
- Current value — the last value the connector read for a node; used to confirm the mapping works.
Workflow overview
- Add a connection — pick or create a machine and add an endpoint. See Add a Connection.
- Configure the endpoint — URL, security mode/policy, timestamp preference. See Endpoints.
- Map NodeIDs — add the values to read and how to interpret them. See Node Mapping.
- Test and verify — run tests, check current values and health. See Testing and Health.
- Optional: Import node definitions in bulk. See Import.
What users see
The connections list shows one card per connection with the machine, the number of NodeIDs, and status badges (for example Attention or Missing current value). An Add connection button starts the wizard; More actions exposes bulk options.
Best practices
- Treat OPC UA settings as technical configuration. Coordinate changes with your automation/IT team.
- Restrict access via roles and follow internal security policy.
- After any change, verify machine data still arrives on the Dashboard.
Troubleshooting
- A connection shows Missing current value -> A NodeID is not returning data -> Open the connection detail and test the nodes -> If it persists, check the endpoint URL and security settings (Endpoints).
- No machine data on the Dashboard after setup -> Endpoint unreachable or NodeIDs misconfigured -> Run Test all on the connection and review the Logs -> Escalate with the endpoint URL and machine ID.